Built for APIs. Not Retrofitted.
Every feature was designed specifically for teams running microservices and API-driven applications — not adapted from general-purpose infrastructure monitoring.
Start Free →Pulse AI — Instant Root Cause Diagnosis
When an incident fires, Pulse AI reads every signal we have — multi-region check data, historical patterns, HTTP context — and returns a diagnosis in under 30 seconds. Instead of staring at a dashboard trying to reconstruct what went wrong, your team opens the incident and already knows what broke, who is affected, and what to do next.
- Automatic AI analysis within 30 seconds of every incident
- Plain-English summary plus technical root cause and user impact
- 3–5 prioritized action items you can act on immediately
- Confidence score and supporting evidence for every diagnosis
- Categorized causes: auth failures, timeouts, regional outages, SSL, DNS, third-party, and more
- Data sanitization guarantees — credentials and PII never leave your environment
Intelligent Monitoring That Learns Your APIs
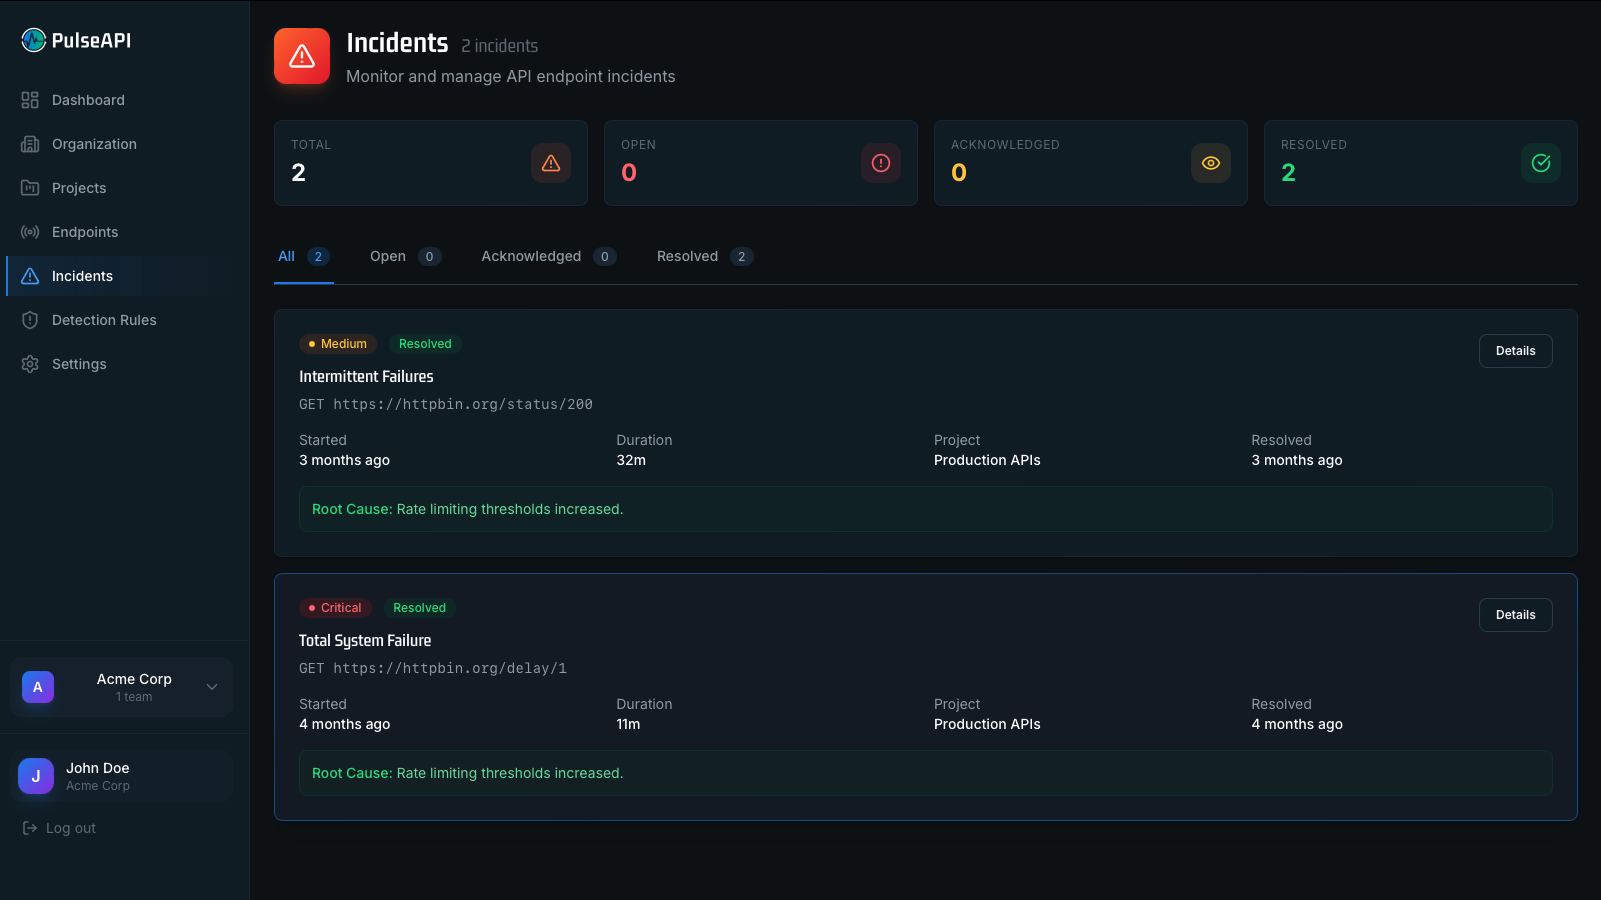
PulseAPI goes beyond "is it up?" It understands what normal looks like for your APIs, detects when responses deviate from expected schemas, and groups cascading failures into a single, actionable incident — not a flood of alerts.
- Automatic baseline learning — adapts to your traffic patterns
- Response schema validation catches breaking changes immediately
- Smart alert grouping reduces pager fatigue by grouping related failures
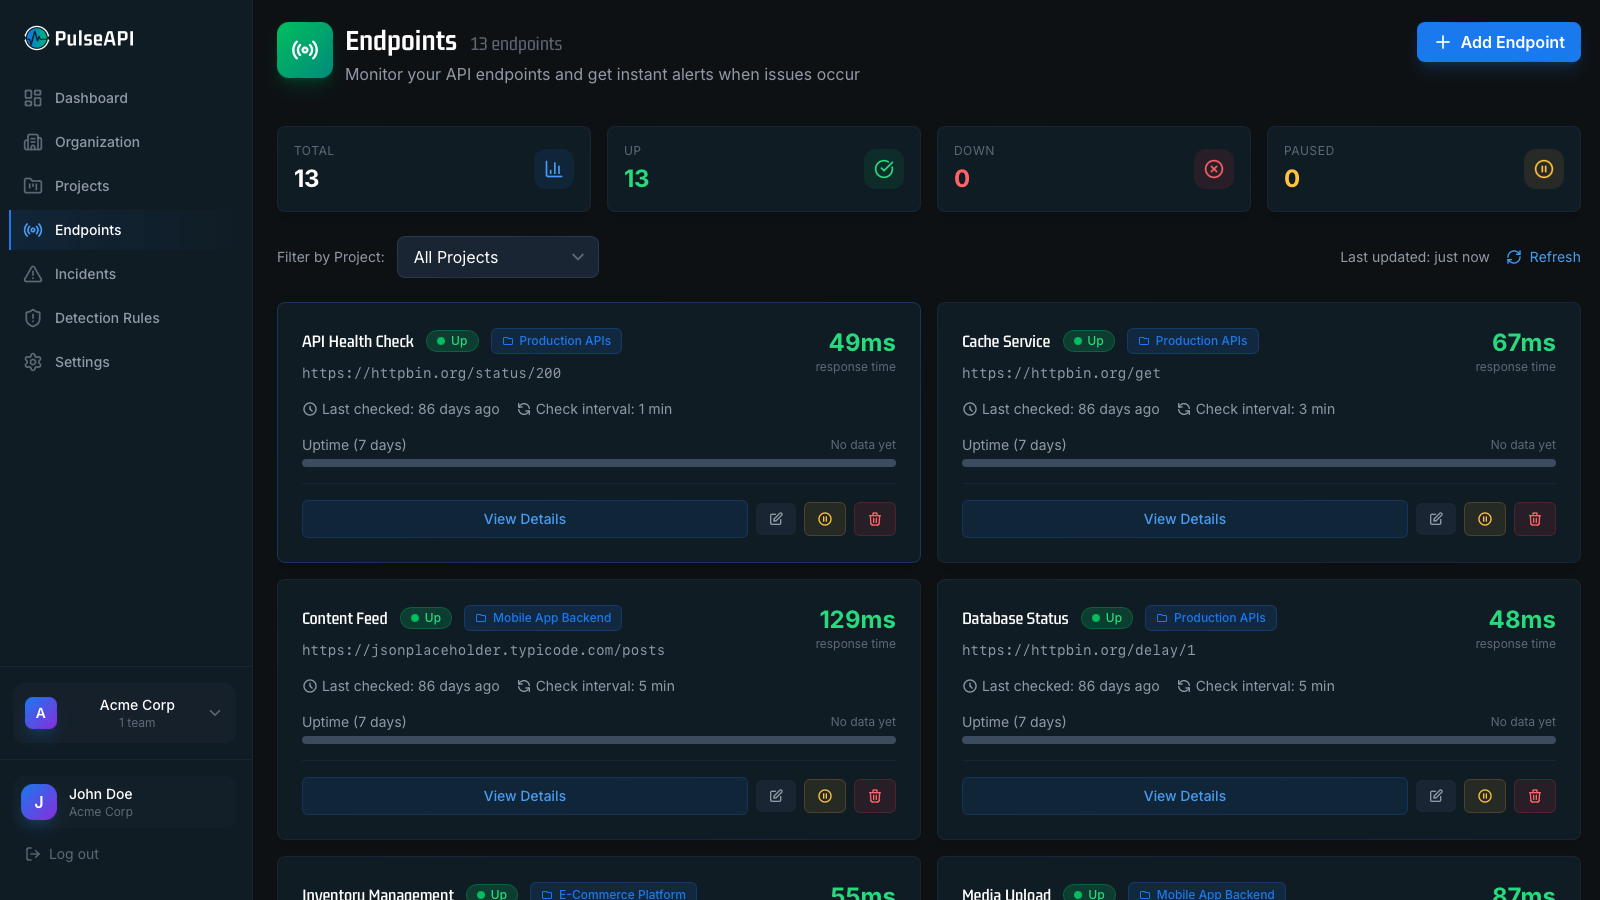
- Configurable detection rules for response time, status codes, and uptime
Built for Microservices Architecture
Microservices fail in complex ways. When your payment API goes down, it might take your checkout, order tracking, and notifications with it. PulseAPI maps those dependencies so you see the root cause immediately, not a wall of unrelated alerts.
- Service dependency mapping — visualize which services depend on which
- Cascading failure detection — know the root cause, not just the symptoms
- Cross-service correlation — connect incidents across multiple endpoints
- Topology view for understanding your API landscape at a glance
API Analytics That Actually Make Sense
Averages lie. A 200ms average response time can hide a P99 of 8 seconds that's ruining 1% of your users' experience. PulseAPI tracks the percentiles that matter, with error rate trending and SLA reporting built in.
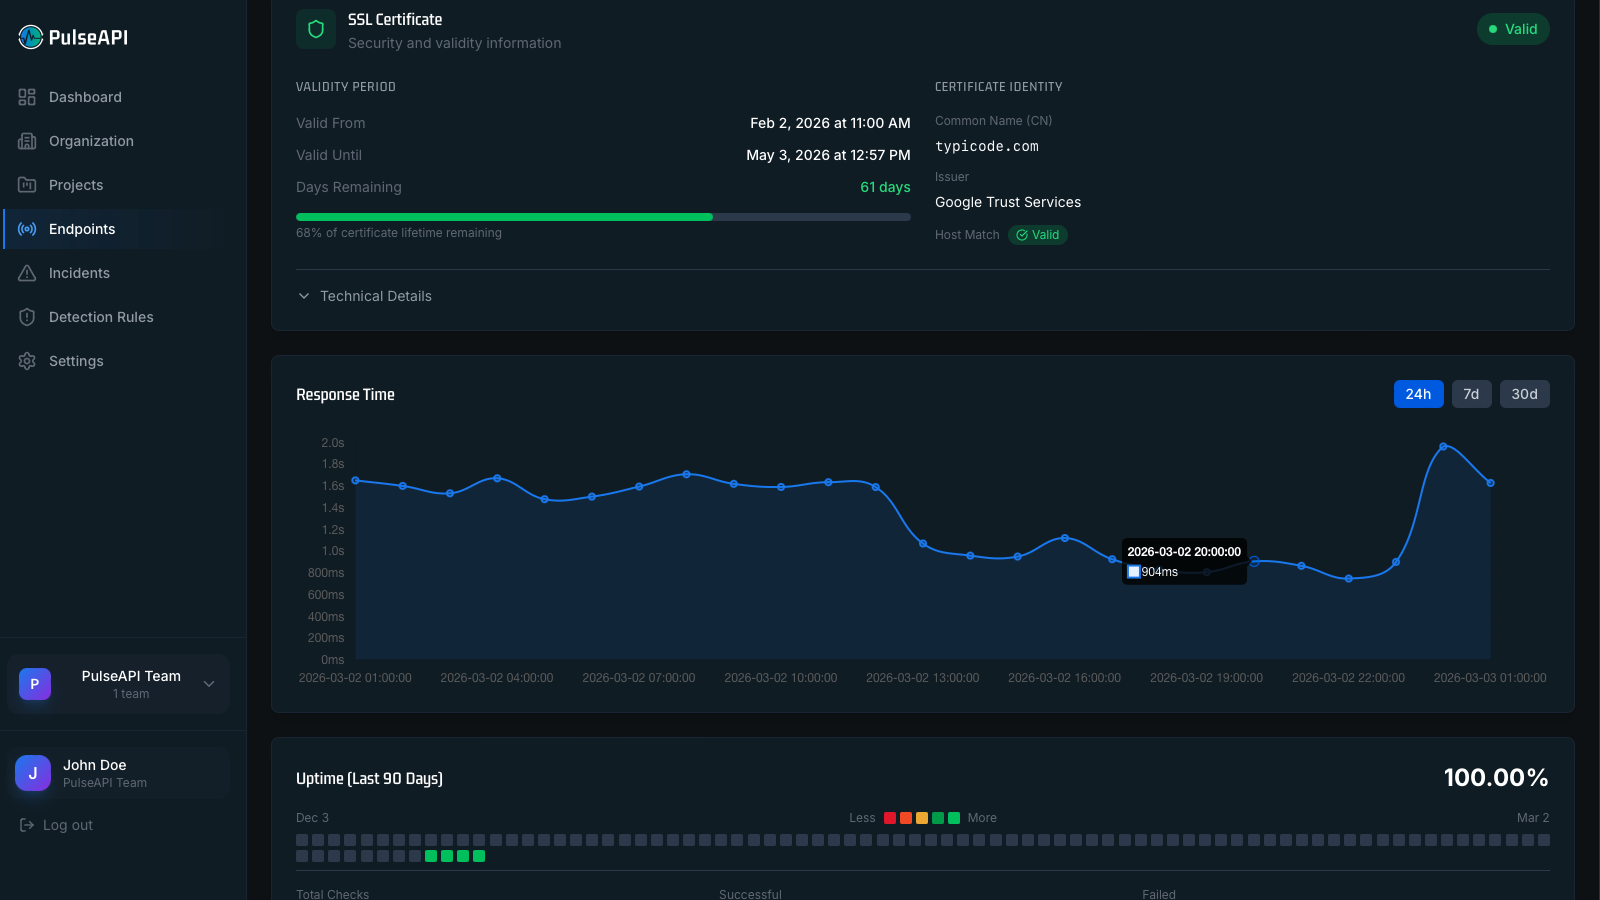
- P50, P95, and P99 latency percentiles — not just averages
- Error rate trending over time with drill-down capability
- Throughput monitoring to catch traffic anomalies early
- SLA tracking with configurable uptime targets
Developer Experience First
Monitoring tools shouldn't require a full-time DevOps engineer to maintain. PulseAPI is designed to get out of your way — sign up, add an endpoint, and you're monitoring. Advanced configuration is available when you need it, invisible when you don't.
- Zero-config setup — paste a URL, monitoring starts in seconds
- Full REST API — every dashboard action is available programmatically
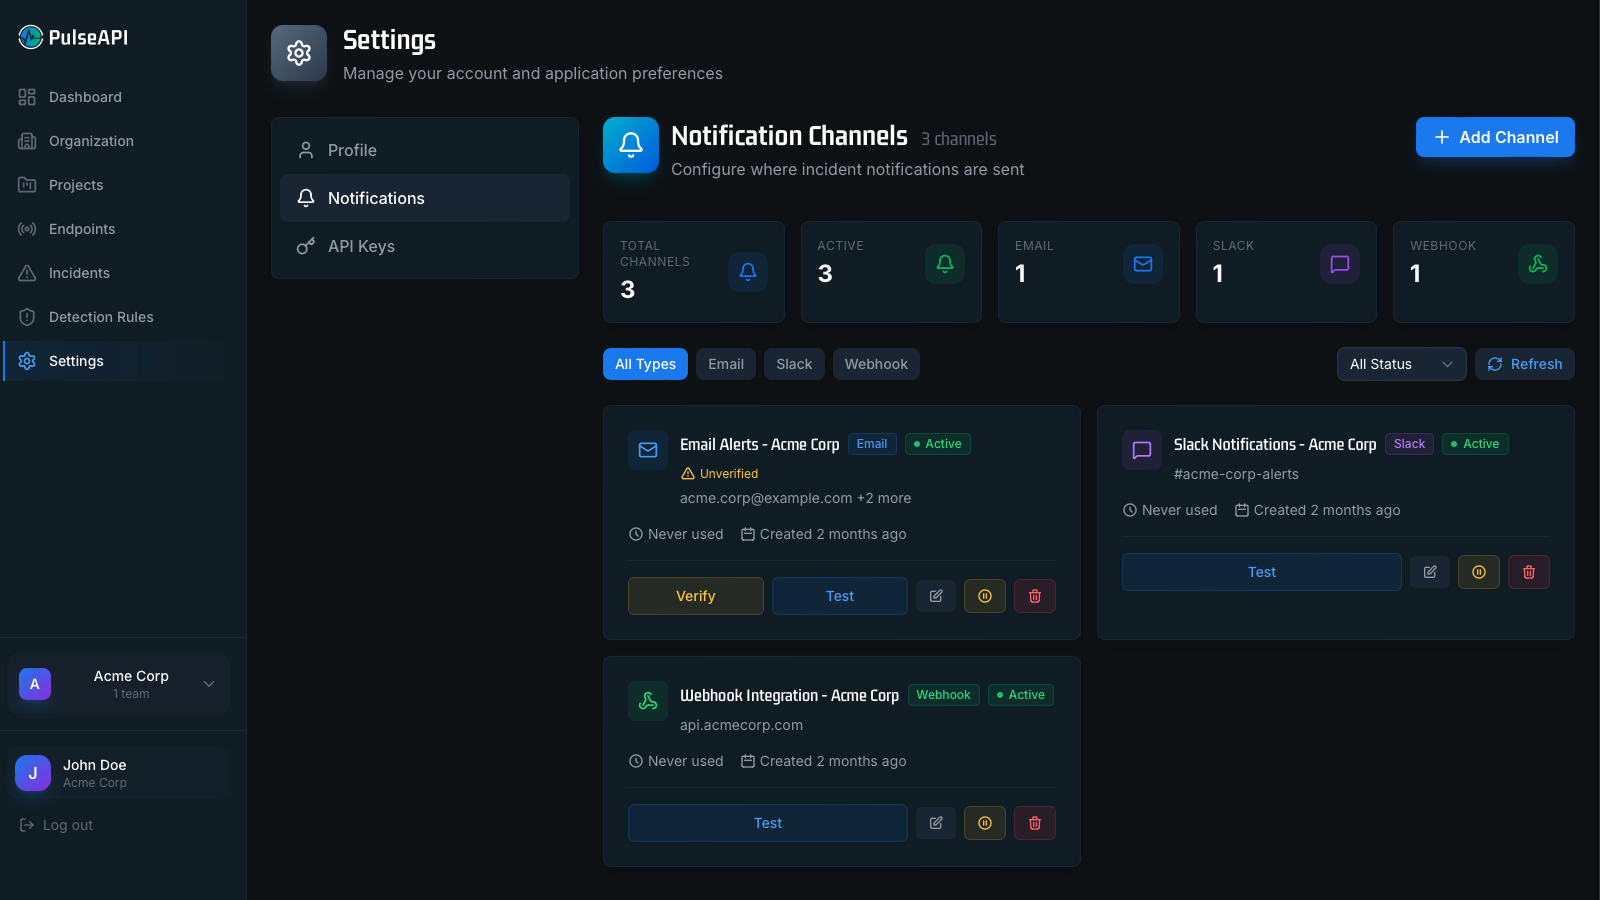
- Webhook integrations for custom alerting workflows
- Team collaboration with role-based permissions
Infrastructure You Can Rely On
We eat our own cooking. PulseAPI monitors its own endpoints with PulseAPI, with 99.9% uptime backed by DigitalOcean infrastructure. Checks run from multiple locations so you're not fooled by regional outages affecting only our monitoring nodes.
- Multi-location monitoring checks from multiple geographic regions
- Configurable check intervals from 1 minute down to 5 seconds
- 99.9% uptime SLA with transparent status reporting
- Encrypted storage and TLS 1.3 in transit — your data is secure
Built for APIs. Not Retrofitted.
Uptime checkers were built to answer one question: "Is it responding?" PulseAPI was built to answer the questions that actually matter when you're running production APIs: What changed? What's affected? What should I do?
| Question | Uptime Checkers | PulseAPI |
|---|---|---|
| Is my endpoint responding? | ✓ | ✓ |
| What's the current response time? | ✓ | ✓ |
| Has the response schema changed? | — | ✓ |
| Which downstream services are affected? | — | ✓ |
| Is this a real outage or a transient blip? | — | ✓ |
| What does normal look like for this endpoint? | — | ✓ |
| What's the P99 latency over the last 7 days? | — | ✓ |
| Are related failures grouped into one alert? | — | ✓ |
An On-Call Engineer Reading Every Incident
Pulse AI classifies every incident into one of eleven root cause categories, with a confidence score and the evidence that led to the diagnosis.
Under 30 seconds
Analysis starts the moment an incident is created. By the time you open the page, the diagnosis is waiting.
Private by design
Request bodies and credentials are sanitized before anything leaves your environment. No PII is ever sent to the model.
Shared with the team
Every teammate sees the analysis on the incident page. Owners, admins, and members can re-run it on demand when new data arrives.
Ready to Monitor Your APIs Intelligently?
Join developers running production APIs. Free for up to 20 endpoints.
Start Monitoring FreeNo credit card · 20 free endpoints · Cancel anytime